GDP Transport & Supply Chain · 7 min read
Temperature Mapping of Warehouses and Storage
A senior QP's guide to temperature mapping of warehouses and storage: protocol design, sensor placement, ALCOA+ data, excursions and requalification under GDP.
By Balasubramanian Ramaiah · 9 June 2026 · Updated 16 August 2026

For any business holding medicines, temperature mapping is the evidence base on which your entire storage claim rests. It is the documented exercise that proves a warehouse, cold room or qualified storage area actually holds product within label conditions, everywhere, before you trust it with a single pallet. Get it wrong and every batch stored becomes difficult to defend; get it right and you have a defensible foundation for release, distribution and inspection.
What temperature mapping is — and why regulators expect it
Temperature mapping is a structured study that characterises the temperature (and, where relevant, humidity) distribution across a defined storage space under realistic conditions. The aim is to identify the warmest and coldest points, demonstrate that the whole volume remains within the required range, and justify where permanent monitoring sensors should sit thereafter.
The expectation is explicit in the EU Guidelines on Good Distribution Practice (2013/C 343/01), which require that storage areas be temperature-mapped under representative conditions before use and that mapping be repeated at defined intervals. The MHRA reinforces this in its Rules and Guidance for Pharmaceutical Distributors (the "Green Guide"), and the same logic flows from EU GMP for manufacturing and warehousing sites. Whether you operate under an MIA or a WDA, the regulator will ask to see the data — not a vendor's brochure claim that the unit "holds 2–8°C".
Mapping, qualification and ongoing monitoring
These three terms are often conflated. Mapping is the temperature characterisation study itself. Qualification is the broader documented exercise — typically IQ/OQ/PQ — that may include mapping as its core performance element. Ongoing monitoring is the routine, permanent measurement that follows, using sensors positioned where the mapping told you the risk lies. Mapping is what makes the monitoring strategy credible rather than arbitrary.
Designing a defensible mapping study
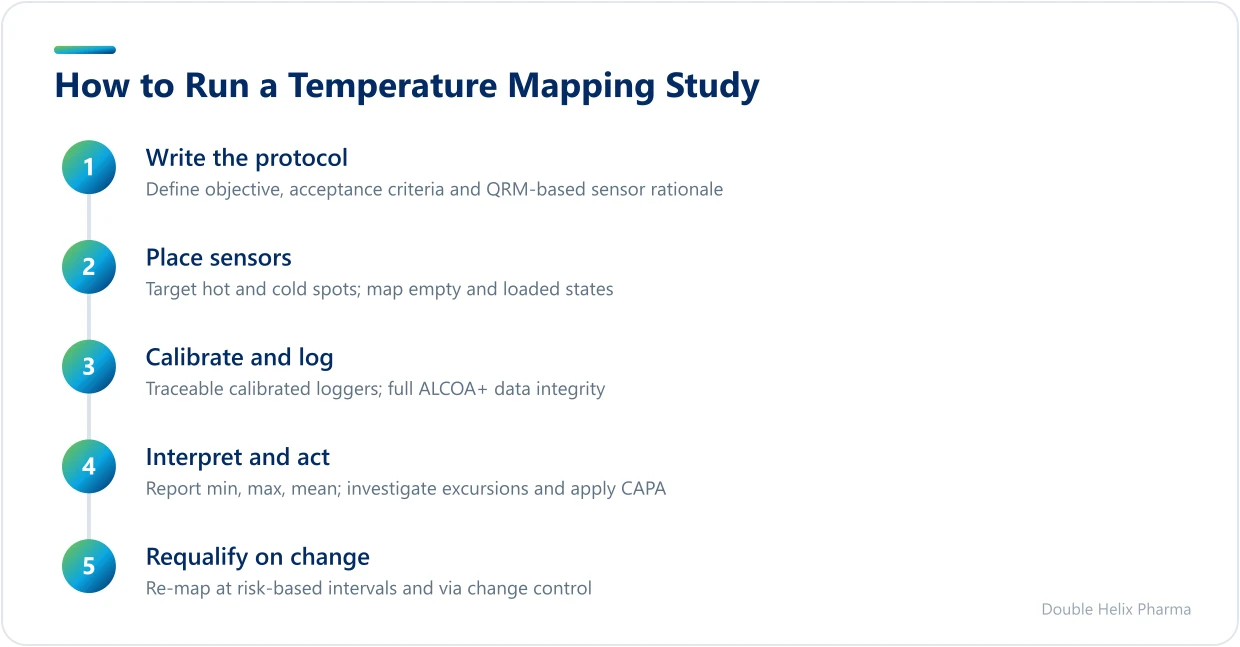
A study stands or falls on its protocol. Before any logger is placed, write and approve a protocol that states the objective, acceptance criteria, the conditions to be tested and the rationale for sensor placement. Anchor it in quality risk management consistent with ICH Q9, so that the number and location of sensors is justified by the risks of the space, not by convenience.
- Number of sensors: driven by volume and complexity. A large ambient warehouse needs a three-dimensional grid; a small validated fridge may need far fewer, but still enough to capture the extremes.
- Placement: target likely hot and cold spots — near doors, loading bays, HVAC outlets and returns, external walls, roof voids, lighting, and the highest and lowest racking levels. Include the geometric centre as a reference.
- Duration: long enough to capture normal operational cycling, typically a minimum of several days and ideally covering at least one full working week including the diurnal cycle.
- Conditions: map under both empty and loaded states where feasible, and challenge the space with realistic stresses such as door openings, restocking and, where relevant, a simulated power or HVAC failure.
Seasonal extremes matter. A warehouse mapped only in mild spring weather tells you little about a July heatwave or a January cold snap. Best practice is to map across summer and winter, or to provide a documented rationale linking a single study to worst-case external conditions.
Sensors, calibration and data integrity
The credibility of a mapping study is only as good as the instruments behind it. Use calibrated data loggers with calibration certificates traceable to a recognised national standard, and confirm that calibration is valid both before and after the study. The sensor accuracy and resolution must be appropriate to the range — a logger that drifts by a degree is worthless for a 2–8°C claim.
Data integrity expectations apply in full. Mapping records must satisfy ALCOA+ — attributable, legible, contemporaneous, original and accurate, plus complete, consistent, enduring and available. In practice that means time-synchronised loggers, secure data with audit trails, no silent overwriting of readings, and a clear chain from raw data to the final report. The principles of ICH Q10 tie this into your wider pharmaceutical quality system, so mapping is not a one-off project but a controlled, repeatable process.
Interpreting results and acting on excursions
Analysis should report the minimum, maximum and mean for every sensor location, the overall range across the space, and any excursions against the acceptance criteria. Crucially, also assess mean kinetic temperature where the product's stability data makes that relevant, since brief, minor excursions are not always meaningful in isolation.
Where the study reveals out-of-range zones, resist the temptation to simply re-run until the numbers look better. Investigate, identify the cause — poor air circulation, a failing door seal, an undersized HVAC unit — and implement corrective and preventive action. The outcome may be physical remediation, a restriction on where product may be stored, or relocation of the permanent monitoring sensors to the identified worst points so that future excursions are caught in real time.
The single most common inspection finding is not the absence of mapping, but mapping that was done once, filed, and never revisited when the warehouse, its racking or its loading patterns changed.
Keeping mapping live: requalification and change control
Mapping is not a permanent qualification. It must be repeated at defined, risk-based intervals and, importantly, triggered by change. Re-map — or formally assess the need to re-map — whenever you alter racking layout, change HVAC capacity, extend or partition a room, significantly change throughput or storage density, or following any unexplained excursion trend.
Link mapping firmly to your change control and self-inspection programmes so that nobody can rearrange a warehouse without the quality unit considering the thermal consequences. This discipline is exactly what protects a robust GDP storage and distribution operation, and it is the kind of joined-up control we help clients build through our GDP supply chain services. You can see how a structured approach plays out in practice in our case studies.
Key takeaways
Done properly, temperature mapping turns a storage claim into demonstrable evidence and underpins everything from batch release to inspection readiness.
- Map under realistic, worst-case and seasonal conditions, with sensor placement justified by quality risk management.
- Use calibrated, traceable instruments and hold the data to full ALCOA+ standards.
- Act on excursions through investigation and CAPA, then position permanent monitoring at the identified worst points.
- Treat temperature mapping as a living activity, re-triggered by change control, not a one-off certificate.
If you need an independent protocol reviewed, a study designed, or your existing mapping data challenged before an MHRA inspection, our QPs and RPs can help. Explore our full range of compliance services or get in touch to discuss your storage and distribution sites.
Regulatory sources
This guidance reflects current UK and EU GMP/GDP requirements. Primary references:
- EMA — GMP/GDP Questions & Answers
- MHRA Inspectorate Blog
- MHRA — UK Medicines & Healthcare products Regulatory Agency
Always confirm against the latest published version of each source.
Frequently asked questions
How many temperature sensors do I need for a mapping study?+
There is no single fixed number; it is driven by the volume and complexity of the space and justified through quality risk management. A large ambient warehouse typically needs a three-dimensional grid covering corners, the centre and high and low racking, whereas a small qualified fridge needs far fewer sensors but must still capture the true extremes. Document the rationale for both the count and the placement in your approved protocol.
How often should warehouse temperature mapping be repeated?+
Mapping should be repeated at defined, risk-based intervals and, just as importantly, whenever a relevant change occurs. Triggers include altered racking or partitioning, changes to HVAC capacity, significant shifts in throughput or storage density, and unexplained excursion trends. Tying requalification to your change control and self-inspection programmes ensures the study stays representative rather than becoming a one-off certificate.
Does temperature mapping need to cover summer and winter?+
Ideally yes, because external climate strongly influences a building's internal thermal profile. Best practice is to map across both summer and winter extremes, or to provide a documented scientific rationale linking a single study to worst-case external conditions. Mapping only in mild weather is a frequent inspection weakness, as it fails to demonstrate control during a heatwave or a hard frost.