QMS & PQS Implementation · 7 min read
Quality Metrics and KPIs Worth Tracking
A senior QP guide to pharmaceutical quality metrics: the leading and lagging KPIs worth tracking, how to set thresholds and drive ICH Q10 review.
By Balasubramanian Ramaiah · 9 June 2026 · Updated 24 September 2026
Most quality teams drown in data yet starve for insight. The right pharmaceutical quality metrics turn a quality management system from a documentation exercise into a genuine early-warning system, surfacing drift before it becomes a deviation and giving senior leaders a defensible view of risk. The hard part is not collecting numbers; it is choosing the handful that actually change a decision.
Why pharmaceutical quality metrics matter to your PQS
Under ICH Q10, a pharmaceutical quality system is expected to deliver continual improvement and to demonstrate management oversight through the management review process. EU GMP Chapter 1 reinforces this, requiring that the effectiveness of the quality system is monitored and that senior management takes an active role. Metrics are the mechanism that makes those expectations operational rather than aspirational.
The MHRA and other inspectorates increasingly probe whether a site truly understands its own performance. A wall of green dashboards means little if it cannot answer the inspector's real question: are you in a state of control, and how do you know? Good metrics let you answer that with evidence, not assertion. They also feed directly into the quality risk management cycle described in ICH Q9, where data informs where attention and resource should go.
Leading versus lagging indicators
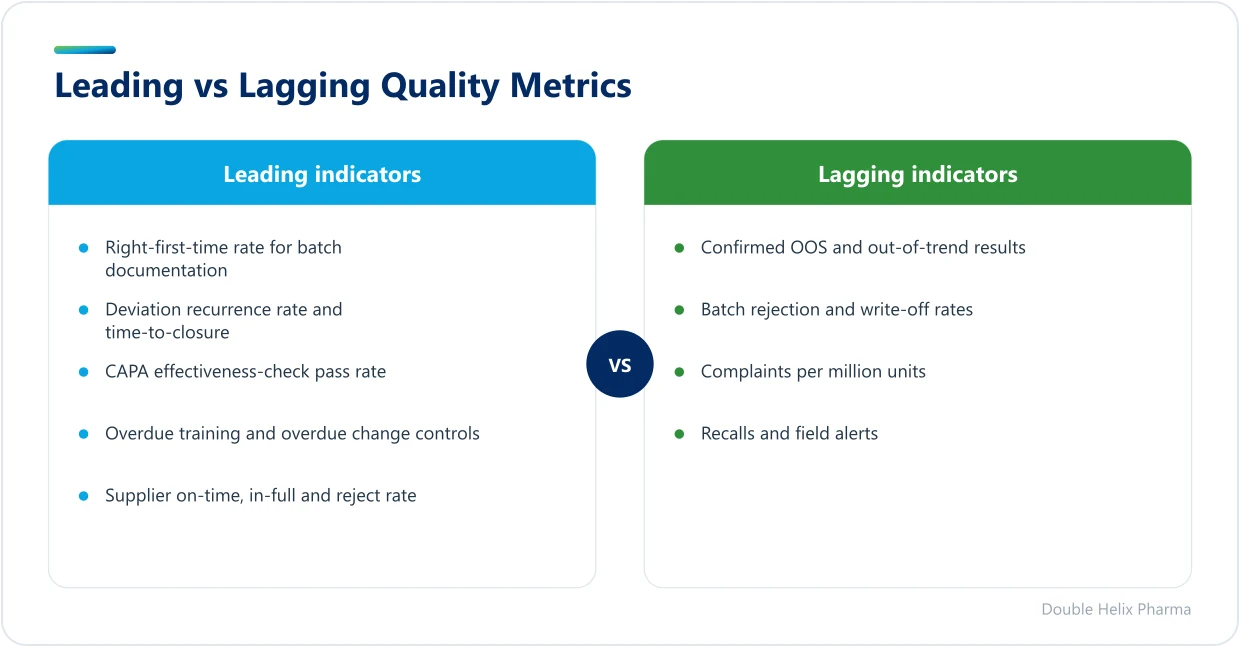
The most common mistake is tracking only lagging indicators, the outcomes that tell you what already went wrong. Recalls, confirmed out-of-specification results and customer complaints all matter, but by the time they move, the harm is done. A mature scorecard balances these against leading indicators that predict future performance.
Lagging indicators
- Confirmed OOS and out-of-trend results
- Batch rejection and write-off rates
- Confirmed product quality complaints per million units
- Recalls and field alerts
Leading indicators
- Right-first-time (RFT) rate for batch documentation
- Deviation recurrence rate and time-to-closure
- CAPA effectiveness-check pass rate
- Overdue training and overdue change controls
- Supplier on-time, in-full performance and incoming reject rate
Pairing the two tells a story. A rising deviation recurrence rate alongside a falling RFT is a clear signal that your corrective actions are not addressing root cause, often long before a complaint trend confirms it.
Core metrics worth tracking across the PQS
There is no universal scorecard, but a defensible set usually covers the four ICH Q10 elements: deviations and change, CAPA, complaints, and management review. The table below is a practical starting point for most CMOs, importers and manufacturers.
Deviation and CAPA health
- On-time closure against your procedural targets, split by criticality so a single overdue critical CAPA is not hidden by dozens of closed minor ones.
- Ageing profile, showing how many records sit beyond 30, 60 and 90 days. Backlog is one of the first things an inspector asks about.
- Recurrence rate, the proportion of deviations that repeat a previously investigated issue. This is the single best test of whether root-cause analysis is working.
Right-first-time and data integrity
RFT for batch records, expressed as the percentage released without error or query, is a powerful operational metric. Complement it with data integrity indicators aligned to ALCOA+, such as the rate of unexplained audit-trail events or invalidated results. With Annex 1 raising expectations for contamination control, environmental monitoring excursion rates and trend breaches deserve a permanent place on the sterile-site scorecard.
Supplier and distribution quality
For importers and wholesale dealers operating under GDP guidelines, track temperature excursions per shipment, supplier qualification status and the proportion of approved suppliers with current quality agreements. These metrics connect the dots between your QMS implementation and the realities of an extended supply chain.
Setting targets, trends and thresholds
A number without context is noise. Each metric needs an owner, a defined data source, a target and an action threshold that triggers escalation. Wherever possible, judge performance by trend rather than a single period; a one-month spike in deviations may be sampling noise, whereas a six-month upward slope is a signal.
If a metric cannot change a decision or trigger an action, stop reporting it. A focused scorecard that drives behaviour beats a comprehensive one that nobody reads.
Be wary of perverse incentives. Pressure to improve on-time CAPA closure can quietly encourage premature closure or shallow investigations. Counter this by reviewing closure quality alongside speed, and by tracking recurrence as a check on both. Normalise volume-based measures, for example complaints per million units rather than raw counts, so that growth in production does not masquerade as declining quality.
Reporting that drives management review
Metrics earn their keep in the ICH Q10 management review. The aim is a concise quality scorecard that lets senior management see the state of control at a glance, interrogate adverse trends and authorise resource. Tier your reporting: operational detail for the shop floor, a curated set for site quality councils, and a small number of strategic indicators for executive review.
Inspectors will look for evidence that the review loop closes, that adverse trends generate documented actions, and that those actions are themselves tracked to completion. A scorecard that simply records numbers without demonstrable follow-through is a finding waiting to happen. We have seen well-designed metric programmes transform inspection narratives, as several of our case studies illustrate.
Key takeaways
Effective pharmaceutical quality metrics are few, owned, trended and tied to action. Balance lagging outcomes with leading predictors, normalise for volume, and guard against measures that reward the wrong behaviour. Above all, make sure every metric you report can survive the inspector's question of how you know you are in control.
- Choose metrics that change decisions, not ones that fill slides.
- Pair leading and lagging indicators to see problems coming.
- Judge by trend and threshold, with a named owner for each measure.
- Close the loop through management review and document the follow-through.
If you are building or rationalising a quality scorecard and want a second opinion grounded in real inspection experience, our team can help. Explore our full range of consultancy services or get in touch to discuss a metrics review tailored to your site.
Regulatory sources
This guidance reflects current UK and EU GMP/GDP requirements. Primary references:
- EU GMP Chapter 1 — Pharmaceutical Quality System
- EudraLex Volume 4 — EU GMP Guidelines
- EMA — GMP/GDP Questions & Answers
Always confirm against the latest published version of each source.
Frequently asked questions
What is the difference between leading and lagging quality metrics?+
Lagging metrics measure outcomes that have already happened, such as confirmed complaints, batch rejections or recalls. Leading metrics predict future performance, for example right-first-time rates, deviation recurrence and overdue change controls. A mature scorecard pairs both, because leading indicators give you the chance to act before a problem reaches the patient or the market.
How many quality KPIs should a pharmaceutical site actually track?+
Fewer than most sites think. The goal is a focused set, often ten to twenty across deviations, CAPA, complaints, data integrity and supplier performance, each with a clear owner and action threshold. If a metric cannot change a decision or trigger an action, it is adding noise rather than insight and should be retired from the scorecard.
Do regulators like the MHRA expect specific quality metrics?+
There is no single mandated list, but EU GMP Chapter 1 and ICH Q10 require that the effectiveness of the pharmaceutical quality system is monitored and reviewed by senior management. Inspectors expect to see metrics that demonstrate a state of control, adverse trends that generate documented actions, and evidence that those actions are tracked to completion through management review.